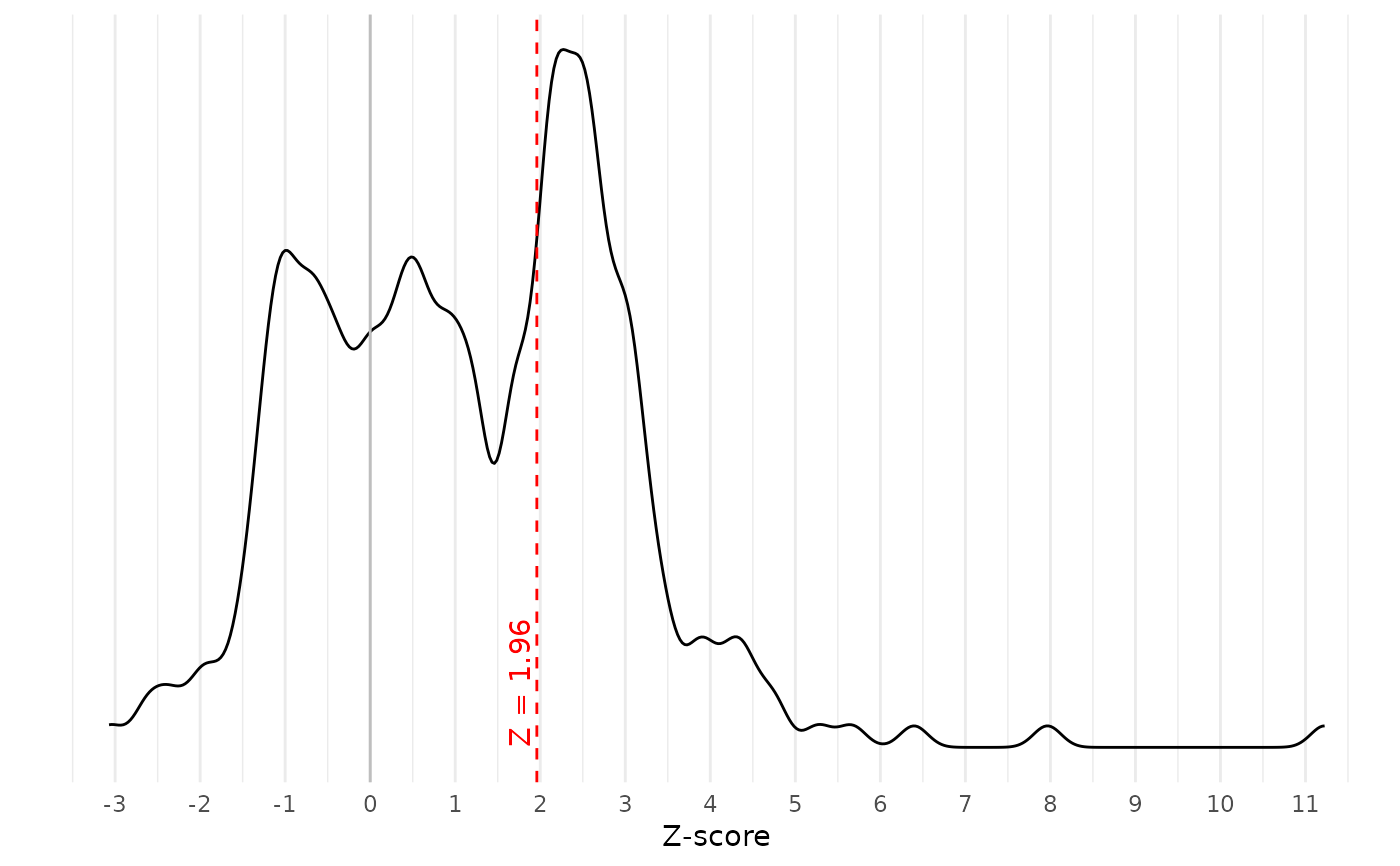
Plots the Z-scores of all published point estimates. When p-hacking favors affirmative estimates over nonaffirmative estimates, as our methods and others assume, Z-scores may disproportionately concentrate just above the critical value (e.g., 1.96). Importantly, the presence of p-hacking does not guarantee a concentration of Z-scores just above the critical value, so it is prudent to proceed with the fitting RTMA even if no such concentration is apparent. In contrast, if Z-scores also concentrate just below the critical value, or if they also concentrate below the sign-reversed critical value (e.g., -1.96), this could indicate forms of p-hacking that violate the assumptions of RTMA.
Arguments
- yi
A vector of point estimates to be meta-analyzed.
- vi
A vector of estimated variances (i.e., squared standard errors) for the point estimates.
- sei
A vector of estimated standard errors for the point estimates. (Only one of
viorseineeds to be specified).- alpha_select
Alpha level at which an estimate's probability of being favored by publication bias is assumed to change (i.e., the threshold at which study investigators, journal editors, etc., consider an estimate to be significant).
- crit_color
Color for line and text are critical z-score.
